|
|
||
| Home | Products | Downloads | Order | Support | Applications | Forum | Testimonials | Company | Contact Us | ||
|
|
||
|
Multi-Instrument 3.9.15 a powerful PC based multi-function virtual instrument software, FREE to try! 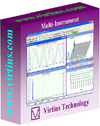 download 21-day fully functional FREE trial and try it out with your sound card |
PC based Oscilloscopes, Spectrum Analyzers, Signal Generators, Logic
Analyzers, Data Acquisition 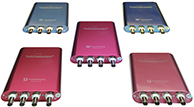 Multi-function, 8~16 bits, high precision, unique hardware based DSP algorithm powered by Multi-Instrument |
PC based Audio & Acoustic Analyzers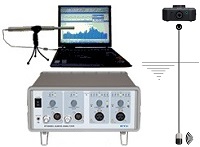 RTX6001 Audio Anlyzer RTA: 168A/B, 168C, 168D, 268A/B/C USA-168A/B Underwater Sound Analyzer powered by Multi-Instrument |
PC based Noise &Vibration Measurement Systems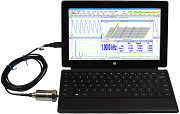 Digital IEPE Interface IEPE-2G05 Digital Charge Amplifier CAMP-2G05 Digital Accelerometer 333D01, 333D04 Powered by Multi-Instrument |
|
PC based
Ultrasonic & Acoustic Emission Measurement Systems 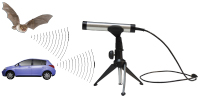 VT UltraMic-384 VT UltraMic-384E powered by Multi-Instrument |
PC based Audiometers |
Sound Recognition Software &
APIs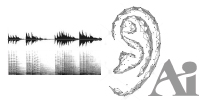 download Sound-Similar Free! |
Probes, Sensors, Measurement
Microphones, Hydrophones, Calibrators, USB Isolators, & Accessories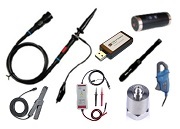 |
| Multi-Instrument Systems - PC Based All-in-One Test and Measurement Solutions | Information |
|
What is Multi-Instrument? Multi-Instrument is a powerful PC based multi-function virtual instrument software. It is a professional tool for time, frequency, time-frequency and modulation domain analyses. It supports a variety of hardware ranging from sound cards, which are available in almost all computers, to proprietary ADC and DAC hardware, such as NI DAQmx cards, Virtins Technology’s Digital Storage Oscilloscopes (DSO), Real Time Analyzers (RTA), Underwater Sound Analyzers (USA), Ultrasonic Analyzers, Digital IEPE Interfaces, Digital Charge Amplifier Interfaces, and so on. It consists of an oscilloscope, spectrum analyzer, signal generator, multimeter and six add-on software modules: data logger, spectrum 3D Plot, vibrometer, LCR meter, device test plan, and dedicated hardware support, all of which can run simultaneously and in real time. It has been widely used in education and training, scientific research, audio and acoustic engineering, electronic engineering, vibration analysis, medical diagnosis, musical instrument inspection, etc. The software can be downloaded from: https://www.virtins.com/MIsetup.exe for a 21-day fully functional FREE trial, using your computer sound card as the ADC and DAC devices. What is a Multi-Instrument system? A Multi-Instrument system consists of three layers (from front end to back end, as shown in the figure below): sensor layer, data acquisition hardware layer and virtual instrument software layer (i.e. Multi-Instrument). (1) Sensor Layer The sensor layer is made up of sensors and their pre-amplifiers (if necessary). It converts physical quantities to electronic signals which can then be quantized by the data acquisition layer. It defines the field of application of the Multi-Instrument system. For example, a passive oscilloscope probe or active differential oscilloscope probe can be used to measure electronic or electrical voltage signals; a current clamp can be used to measure electronic or electrical current signals; a microphone can be used to sense sounds, an acceleration sensor can be used to sense vibration; an ECG sensor can be used to sense the electrical activity of the heart, etc..The sensor layer can also contain actuators such as speakers and vibration shakers. (2) Data Acquisition Hardware Layer The data acquisition hardware layer contains the data acquisition hardware such as Virtins Technology's PC based USB Oscilloscopes, Spectrum Analyzers and Signal Generators, Virtins Technology's Real Time Analyzers, NI DAQmx cards, sound cards, etc. It scales, conditions and quantizes the electronic or electrical signals passed on by the sensor layer. Together with the sensor layer, it defines the measurement accuracy and precision of the Multi-Instrument system. This layer can also contain DAC hardware which converts the digial signal from the computer to analog signal in order to drive the actuators such as speakers in the sensor layer. (3) Virtual Instrument Software Layer The virtual instrument software layer is dominated by the Multi-Instrument software. It defines the functions and Graphical User Interfaces (GUI) of the Multi-Instrument system. In general, the Multi-Instrument system is extremely powerful, flexible, customizable, yet cost-effective. Simply through software configuration without any coding, it is possible to achieve custom functions that can only be realized through custom software development using programming tools such as Labview, Matlab, C++, etc. A properly configured Multi-Instrument system will meet your every need in test, measurement, monitoring and control. 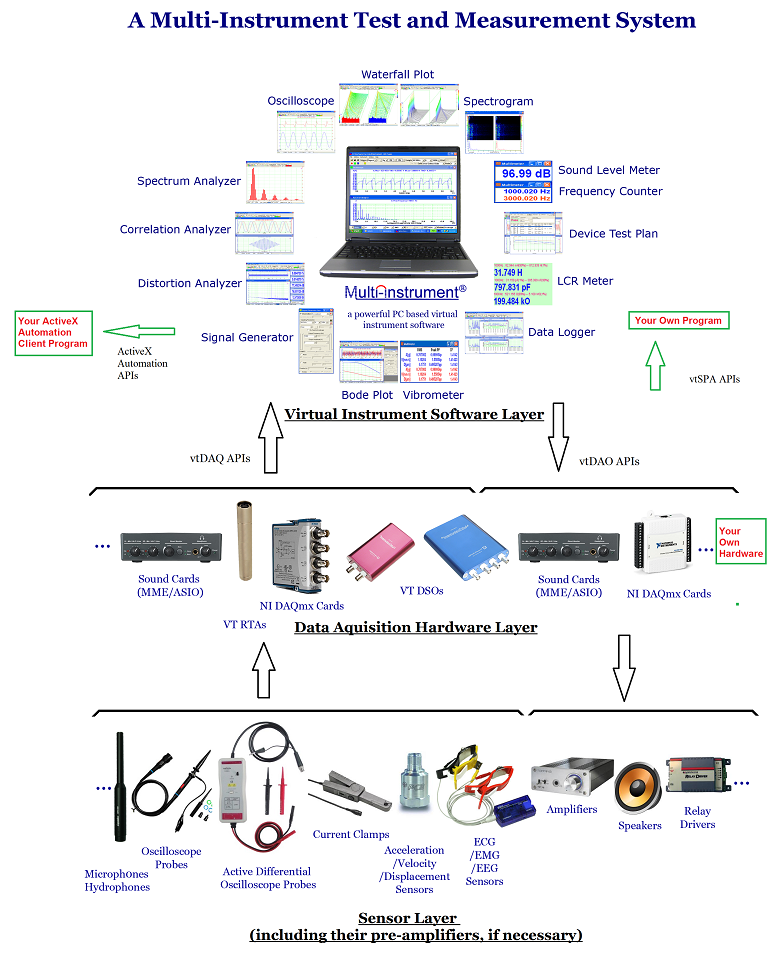 Oscilloscope separate waveforms, waveform addition, subtraction and multiplication, Lissajous Pattern, mixed signal display, long-time signal recording (streaming mode), pre-configured or arbitrary digital filters (FFT, FIR, IIR), half/full wave rectification, demodulation (AM, FM, PM), digital persistence display, equivalent time sampling, roll mode, etc.. Spectrum Analyzer amplitude spectrum, octave analysis (1/1, 1/3, 1/6, 1/12, 1/24, 1/48, 1/96), frequency compensation, frequency weighting (A, B, C, ITU-R 468), peak hold, linear / exponential average, measurement of THD, THD+N, SNR, SINAD, Noise Level, IMD, Bandwidth, Crosstalk, peaks, harmonics, wow & flutter, sound loudness and loudness level; phase spectrum, auto / cross correlation, coherence function, transfer function (Bode plot, gain and phase plot, or frequency response), impulse response. Support 55 window functions and window overlap. Signal Generator function / multitone / arbitrary waveform / burst tone / MLS / DTMF / musical scale / white noise / pink noise generation, frequency/amplitude sweep, fade in/out, output modulation (AM, FM, PM), wave file replaying. Support both streaming mode and DDS mode. Multimeter voltmeter, sound pressure level meter(dB, dBA, dBB, dBC), frequency counter, RPM meter, counter, duty cycle meter, F/V converter, cycle mean/RMS, pulse width. Vibrometer waveform conversion among acceleration, velocity and displacement, when the raw data are acquired from acceleration, velocity or displacement sensors. This function is designed specially for vibration analysis. Spectrum 3D Plot waterfall and spectrogram. Data Logger long time data logging for 185 derived data points (DDP) and 16 user defined data points (UDDP), including RMS values, peak frequencies, sound pressure levels, RPM, THD, etc. Up to eight data logger windows can be opened and each window can trace up to 8 variables. LCR meter measure the value of an inductor, capacitor or resistor, or the impedance of a network of them. Device Test Plan It provides a mechanism to configure and conduct the user’s own device test steps. It takes the advantage of the sound card’s (or other ADC/DAC device's) capability of simultaneous input and output, to generate a stimulus to the Device Under Test (DUT) and acquire the response from that device at the same time. Different stimuli can be generated and the response can be analyzed in different ways. The DUT can be marked as PASS or FAIL after a sequence of test steps. Device Test Plan supports connection with external systems through serial communication. DDP Viewer It is used to display the value of a Derived Data Point (DDP) in a dedicated window with bigger font size. It is also possible to specify the DDP’s high-hgih, high, low, low-low limits for alarming and the number of decimal places for display. Up to 16 DDP viewers can be opened. These DDP viewers can also be used to define and display User Defined Data Points (UDDP). A UDDP can be expressed as a function of DDPs and earlier-updated UDDPs. The mathematical expression may consist of constants, DDPs, UDDPs, mathematical operators, and mathematical functions. DDC (Derived Data Curve) Energy Time Curve (Log-Squared), Energy Time Curve (Envelope), Energy Time Curve (dBSPL), Impulse Response Schroeder Integration Curve, Step Response Curve (via Impulse Response Integration), Frequency Time Curve, X-Y Plot, Shock Response Spectrum, etc.. General Functions Sensor Sensitivity The acquired data can be rescaled according to the sensor sensitivity configured by the user so that the displayed data are expressed in engineering unit corresponding to the physical quantity sensed by the sensors. This is very different from a conventional oscilloscope whereby only voltage can be displayed. Graph Operation Zooming and Scrolling is supported in all graphs, allowing you to investigate the fine details of the data. This is very important when a large amount of data are displayed in one screen. A cursor reader is provided in each graph to show the x and y readings of the actual measurement point. For Spectrum 3D Plot, the cursor reader supports the readout of x, y, t values of the actual measurement point. Two markers are provided in each graph to get the x and y readings of the actual measurement points nearest (in horizontal direction) to the points of the mouse clicks. Five chart types are supported: Line, Scatter, Column, Bar, Step. Line width and colors of the graph are configurable. Options are provided to either display all data points (slow) or only display one data points per vertical raster line (fast). The data in any graph can be copied into the clipboard as text and later paste into other software such as Microsoft Excel for further analysis. The image of the graph can be copied into the clipboard as Bitmap image and later paste into other software such as Microsoft Word. Reference Curves Up to five reference curves can be set for each channel in each graph. The reference curve can be configured by either copying the current curve, or loading a properly formatted text file or a previously saved reference file from the hard disk. File Import and Export The collected frame of data can be saved as a wave file (*.wav) or exported as a text file (*.txt). All analysis results can be exported as text files (*.txt). All graphs can be exported as bitmap files (*.bmp) or printed out directly. A long wave file can be imported frame by frame either manually or automatically. Wave files with PCM format or properly formatted text file can be imported for analysis. The signal generated by the signal generator can be saved as a wave file or a text file for a given duration of up to 1000 seconds. Data Merging and Extraction Combining data from individual channels of different wave files, and extracting part of data from a wave file are supported. Save and Load Panel Setting You can save your preferred instrument panel setting either as default or as a customized panel setting for later use. Controls/Options Enabling and Disabling Graphical User Interface items such as menu items, button, combo box, edit box, radio box, check box are enabled/disabled based on context, so as to void any mis-understanding and mis-operation. Multilingual User Interface It supports Multilingual User Interface under Windows XP, Vista, 7, 8/8.1/10. Supported languages are English, French, German, Italian, Portuguese, Spanish, Russian, Simplified Chinese, Traditional Chinese, Japanese and Korean. Software Customization Multi-Instrument provides the following user customizable features: 1) You can save a frequently used panel setting as a Panel Setting File 2) You can save your default pane setting so that it will be loaded right after software startup. 3) You can configure your frequently used Panel Setting Files in the Hot Panel Setting Toolbar, so that they can be loaded at one single mouse click. Software Development 1. Multi-Instrument can work as an ActiveX automation server so that an external program can access the data and functions that Multi-Instrument exposes. You can integrate Multi-Instrument into your own software seamlessly via the ActiveX automation server interfaces exposed by Mutil-Instrument. Please refer to: Multi-Instrument Automation Server Interfaces. 2. You can use the vtDAQ and vtDAO interface DLLs supplied in the software to allow your own back-end software to interface to sound cards, NI DAQmx cards, VT DSOs, VT RTAs, etc.. As all these devices conform to the same vtDAQ and vtDAO interface standard, you only need to write the interface codes in your program once and your program will support all these devices. You can also develop your own vtDAQ and vtDAO compatible DLLs to allow Multi-Instrument to interface to your own hardware. Please refer to: vtDAQ and vtDAO Interfaces. 3. Virtins Technology’s Signal Processing and Analysis (vtSPA) Application Programming Interfaces (APIs) provides a suite of generic APIs for data processing and analysis. It contains some unique features / algorithms originated and only available from Virtins Technology. Please refer to: Signal Processing and Analysis (vtSPA) Interfaces. >>more What is the second-generation VT DSO (Digital Storage Oscilloscope)? The second-generation VT DSOs are the latest PC based USB oscilloscopes, spectrum analyzers and signal generators designed and developed by Virtins Technology. They feature Virtins Technology’s unique hardware-based DSP algorithm which enhances the performance and functionality dramatically without adding extra hardware cost. When used in conjunction with Multi-Instrument software, these VT DSOs convert any desktop, laptop, or tablet PC into a powerful oscilloscope, spectrum analyzer, multimeter, data logger, signal generator and so forth, all of which work simultaneously. Compared with the first-generation VT DSOs and those USB oscilloscopes from other manufacturers, this new generation has the following major advantages: 1) Hardware DSP Based Bit Resolution Enhancement for Oscilloscope 2) Streaming Mode in Oscilloscope 3) Oscilloscope Digital Trigger and Trigger Frequency Rejection 4) Oscilloscope Persistence Mode 5) External Trigger Input Channel as a Digital Input Channel 6) Adaptive Anti-aliasing Filter for Spectrum Analyzer 7) Signal Generator DDS and Streaming Modes 8) Signal Generator DDS Interpolation 9) Simultaneous Data Acquisition and Data Output 10) Calibration and Re-Calibration 11) Upgradable Software, Firmware, and Hardware Based DSP Algorithm >>more details What is a RTA (Real Time Analyzer)? Real Time Analyzers (RTAs) or Real Time Audio Analyzer are often used by sound engineers and acousticians installing audio systems in all kinds of listening spaces: auditorium, home theatres, cars etc. They are used to measure in real time the frequency response of an audio system within the confinement of the environment, taking into account the frequency response of the audio system itself as well as all the environmental effects such as resonance and constructive and destructive interference. One can then adjust the equalizer to make an inversed frequency response such that the combined frequency response is flat or aligned to the preference of the audiences. Normally pink noise is used as the test tone and octave analysis is set in the spectrum analyzer. VT RTA-168 is a PC based USB real time analyzer, sound level meter and distortion analyzer, polarity tester... It is able to perform all the functionality of a conventional RTA such as the measurements of frequency response and sound level, with finer resolution and higher accuracy thanks to the computing power of a modern computer. In addition, it can measure various types of distortion and perform a comprehensive set of functionality that is usually not found in a conventional RTA. >>more |
About Us We are committed to providing state-of-the-art yet affordable PC-based virtual instrument products with the highest quality and unmatchable technical support... Contact Us Contact us through online live chat, email, or telephone. Testmonials "You are certainly the most innovative in this field. Congratulation!" -Dr. Kiran Schmidt >>more Press Presence Our products have been reviewed, featured, or mentioned in the world's leading electronics magazines. Online Store You can find a full list of our products in our online store. You can also purchase products on their respective product description pages. Contact us if you need to go through formal procurement procedure. FAQ You can find the answers to the most frequently asked questions here. Software Registration You can activate, re-activate, transfer, or extend your license here. The license is permanent and software upgrade for the same license level is FREE for life. Hardware Remote Upgrade Hardware Remote Upgrade is used to upgrade the software license level associated with the hardware. The hardware can be a USB hardkey or any ADC/DAC hardware manufactured by Virtins Technology. Download This is where you can download software and documents. You can also find the release notes here. Forum You can discuss anything relevant to test and measurement here. Applications You can find a list of application notes, slides, videos here. List of conventional test instruments that can be replaced by properly configured Multi-Instrument systems: 1) Oscilloscope 2) Spectrum Analyzer 3) Signal Generator 4) Multimeter 5) Vibrometer 6) Waterfall Plot 7) Spectrogram 8) Data Logger 9) LCR Meter 10) Automated Test Equipment 11) Audio Analyzer 12) Real Time Analyzer 13) Sound Level Meter 14) Audio Spectrum Analyzer 15) Distortion Analyzer 16) Noise Analyzer 17) Arbitrary Waveform Generator 18) Dynamic Signal Analyzer 19) Octave Analyzer 20) Pink Noise Generator 21) White Noise Generator 22) MLS Generator 23) Real Time Sound Analyzer 24) Real Time Audio Analyzer 25) DUT Analyzer 26) Power Analyzer 27) Harmonics Analyzer 28) Shock Measurement Analyzer 29) Network Analyzer 30) RPM Meter 31) Correlation Analyzer 32) Frequency Counter 33) Logic Analyzer 34) Power Meter 35) Duty Cycle Meter 36) Signal Analyzer 37) Sound Card Oscilloscope 38) Sound Card Spectrum Analyzer 39) Sound Card Signal Generator 40) FFT Analyzer ... |
| Home | Products | Downloads | Order | Support | Applications | Forum | Testimonials | Company | Contact Us |
|


