|
|
||
| Home | Products | Downloads | Order | Support | Applications | Forum | Testimonials | Company | Contact Us | ||
|
|
||
| Sound Monitoring & Matching API based on Sound Similarity Measurement (for Sound Recognition Projects) | |||
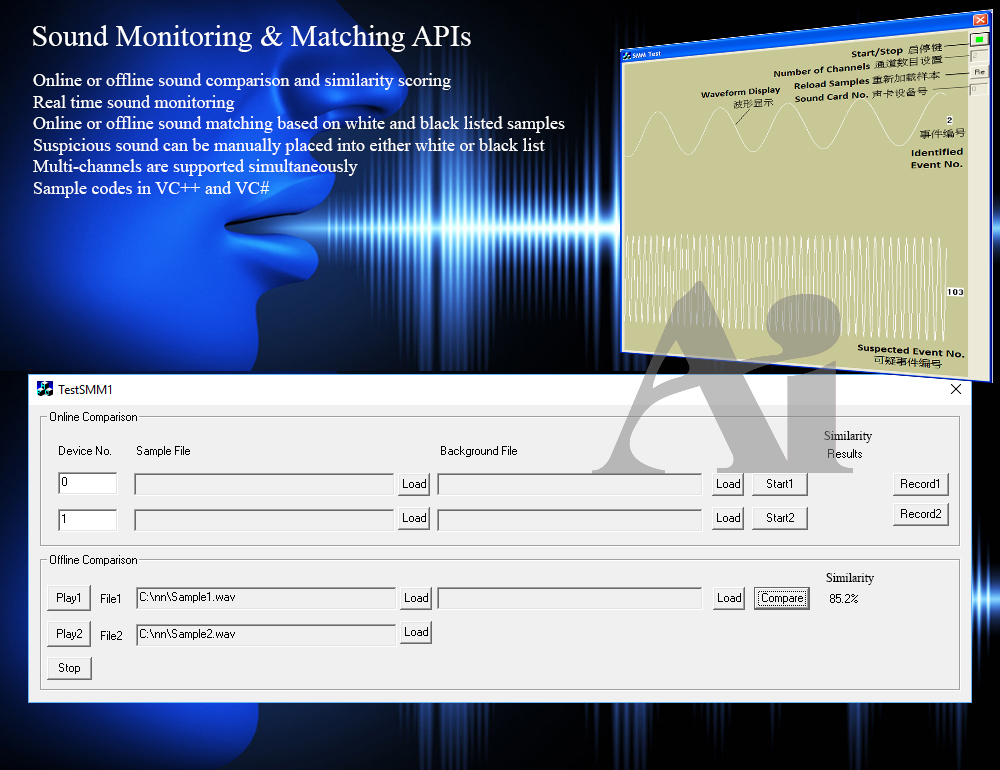 Sound Monitoring & Matching APIs based on Sound Similarity Measurement (for Sound Recognition Projects) Sound recognition is one of the main application areas of artificial intelligence. Various sound recognition techniques exist and can be used for recognizing speeches, music, environmental sounds, animal sounds, air-borne or structure-borne machine sounds, etc. These techniques contain in common signal pre-processing, feature extraction and feature matching / classification algorithms from a general perspective. However, they differ in implementation in different applications. For example, there are a few good automatic speech recognition software products and APIs, however, they just cannot be used directly in animal sound classifications. Specific sound recognition applications usually require custom programming. Virtins Technology has been actively involved in this line of business for years. Some projects that we have completed are: 1. 16-Channel real-time sound monitoring and matching of normal and abnormal sounds in unmanned electrical substations (as compared with normal and abnormal sound samples) 2. Factory Pass/Fail testing on the music quality of music boxes (as compared with standard music samples) 3. Factory Pass/Fail testing on the sound correctness and quality of multi-sound generation toys (as compared with standard sound samples) Through years of researches and driven by actual projects, we have developed a suite of sound recognition API as well as VC++ and VC# sample programs. The API is called Sound Monitoring & Matching API. Its features include: 1. Online or offline sound comparison and similarity scoring 2. Real time sound monitoring 3. Online or offline sound matching based on white and black listed samples 4. Suspicious sounds (those that do not directly fall into white and black list) can be manually confirmed and placed into either white or black list 5. A sound card with multiple channels or multiple single-channel sound cards are supported. The freeware Sound-Similar (Free Version) below is developed using this API. Contact us for details if interested. Last but not the least, some applications may look as if they require advanced sound recognition techniques, but their tasks could actually be performed successfully through proper configuration of Multi-Instrument. Here is such an example, see video: Identification of Lighter Sounds in a Controlled Environment.
Sound-Similar (Free Version) is a lightweight software application that measures the perceptual similarity between two WAV files in Linear PCM format, the most commonly used format in WAV files. The degree of similarity is represented by a similarity score in percentage, from 0% to 100%. The software does not compare the two digital files bit by bit. Nor does it measure the resemblance of the two waveforms. The similarity is rated based on human auditory perception through advanced time, frequency, and time-frequency domain analyses. The resultant similarity score can be used for sound classification as well as perception-based sound quality check. The two WAV files to be compared can have different sampling rates, bit depths, and one or two channels of data. If the file is stereo, then average values of the two channels will be used for comparison. Sound volume difference does not affect the similarity measurement unless it is too low to maintain the perceptible sound quality. The frequency ranges of different classes of sounds, such as human speeches, music and environmental sounds, may be different. Sound-Similar allows the user to specify the comparison frequency range in order to increase the scoring accuracy. It is possible to extend this range to infrasonic or ultrasonic region. There are two comparison modes: (1) Full Length vs Full Length, and (2) Full Length of the Shorter vs Partial Length of the Longer. In both modes, the two WAV files can have different lengths in time. Mode 2 can be used to check whether the shorter is a part of the longer and, if YES, where the shorter is located in the longer. The minimum length of the sound should be at least 50 ms and greater than the reciprocal of the frequency lower limit. There is virtually no restriction on the upper limit of the sound length as long as the computer memory allows. There are three similarity modes: (1) Disregard Transmission Channel Difference; (2) Penalize for Transmission Channel Difference; (3) Penalize for Transmission Channel Difference and Heavily for any Difference in Content Delivery Speed. Version 1.0 supports Similarity Mode 1 only. Similarity Modes 2 and 3 were added in Version 1.1. The similarity scoring algorithm in the software has been optimized for general-purpose use. A similarity score below a few percent usually indicates that the two sounds are totally different, while a score from a few percent to 100% often shows that the two are alike with a varying degree of similarity. In other words, not only can Sound-Similar classify sounds but also perform quality check against standard samples. Sound-Similar was programmed using Sound Monitoring and Matching (SMM) API developed by Virtins Technology. The underlying API is much more flexible in setting various comparison parameters and has more advanced options such as background noise removal, short-time noise and distortion detection and different scoring methods. 1. Stationary or Quasi-Stationary Sound Comparison Examples: (1) DTMF tone recognition (POSITIVE): DTMF-1-SR44100-16Bit-2s-Ideal.wav vs DTMF-1-SR44100-16Bit-2s-Noisy.wav Both are 2-second DTMF tone "1" consisting of 697Hz and 1209Hz, sampled at 44.1kHz and 16 bits. The former was generated digitally by the signal generator of Multi-Instrument and thus is ideal without noises. The latter was recorded by a microphone from the same tone output by a speaker and thus contains substantial background noises. The volume difference is about 8 dB. The following picture shows the comparison of their waveforms, spectra and spectrograms. The measured similarity score is 99.5% thanks to the anti-noise setting inside Sound-Similar Free. Thus the answer is POSITIVE (i.e. not FALSE NEGATIVE). 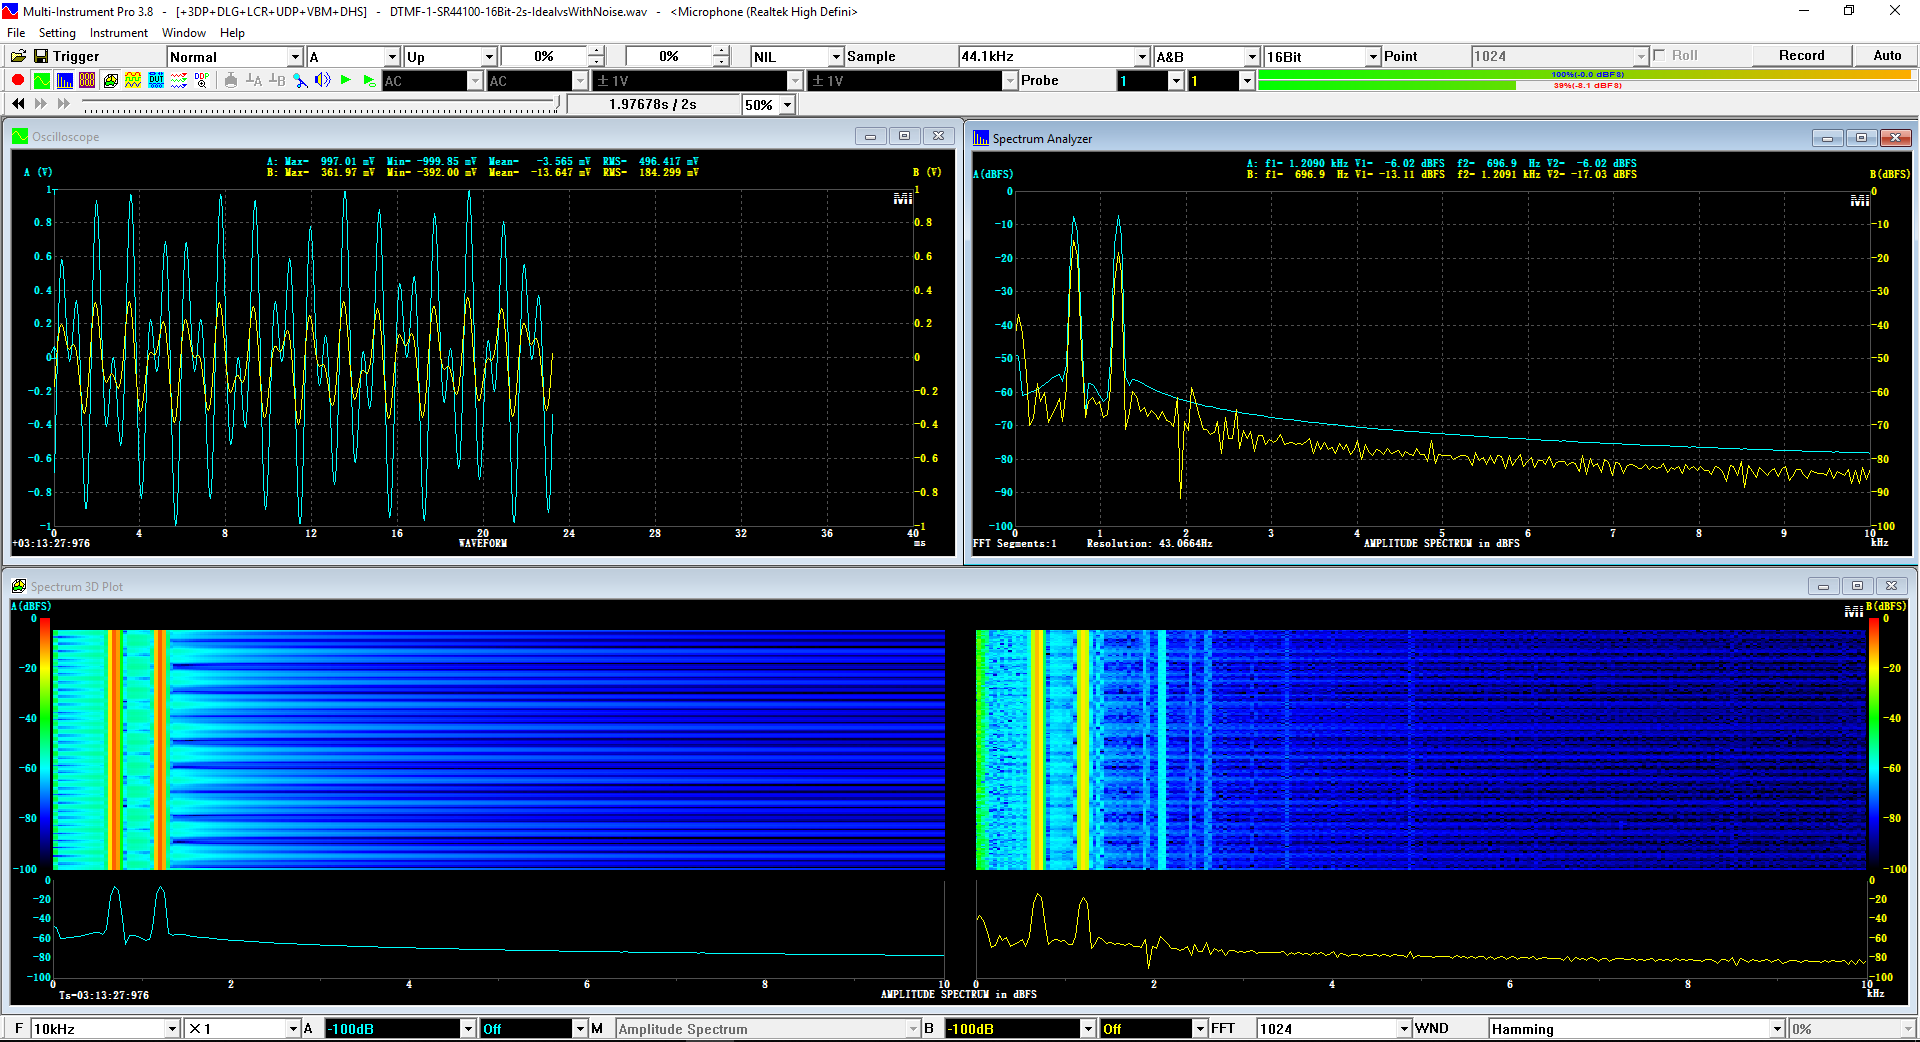  (2) DTMF tone recognition (NEGATIVE): DTMF-2-SR44100-16Bit-2s-Ideal.wav vs DTMF-1-SR44100-16Bit-2s-Noisy.wav The former is 2-second DTMF tone "2" consisting of 697Hz and 1336Hz, sampled at 44.1kHz and 16 bits. The latter is 2-second DTMF tone "1" consisting of 697Hz and 1209Hz with the same sampling parameters. The former was generated digitally by the signal generator of Multi-Instrument and thus is ideal without noises. The latter was recorded by a microphone from the sound output by a speaker and thus contains background noises. The volume difference is about 8 dB. The following picture shows the comparison of their waveforms, spectra and spectrograms. The measured similarity score is 12.1% and thus the answer is NEGATIVE (i.e. not FALSE POSITIVE). It should be noted that DTMF tones are quite similar to one another when perceived by humans. If two different DTMF tones have one frequency component in common, their similarity score can go up to a few tens of percent. However, if the two DTMF tones have two frequency components in common (i.e. same DTMF tones), then their similarity score will be very close to 100%.  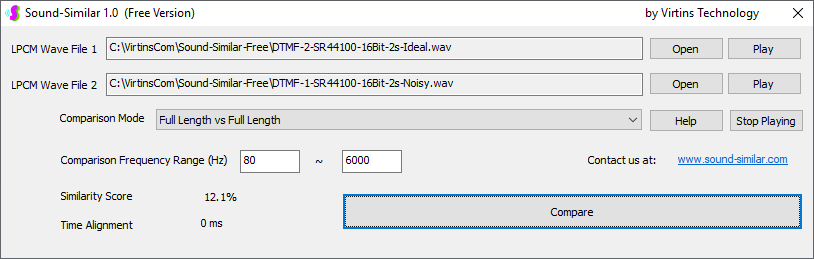 (3) Effect of the volume difference on similarity score: DTMF-1-SR44100-16Bit-2s-Ideal_-60dB vs DTMF-1-SR44100-16Bit-2s-Noisy.wav This test is similar to the above Test 1(1) except that the volume of the first one is 60dB lower (i.e. 1/1000) than that of Test 1(1) or 52dB lower than the second one here. The similarity score is 96.6%, dropped only a little bit from 99.5% in Test 1(1), showing that the volume difference has little impact on the similarity score. 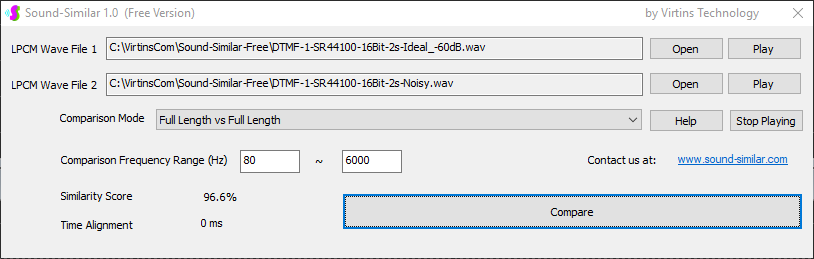 (4) Effect of the length difference on similarity score: DTMF-1-SR44100-16Bit-10s-Ideal.wav vs DTMF-1-SR44100-16Bit-2s-Noisy.wav This test is similar to the above Test 1(1) except that the first one is 10-second long here, five times as long as the latter. The similarity score is 99.4%, almost unchanged compared with Test 1(1). It should be noted that the longer one here contains the same stationary signal across its full length. 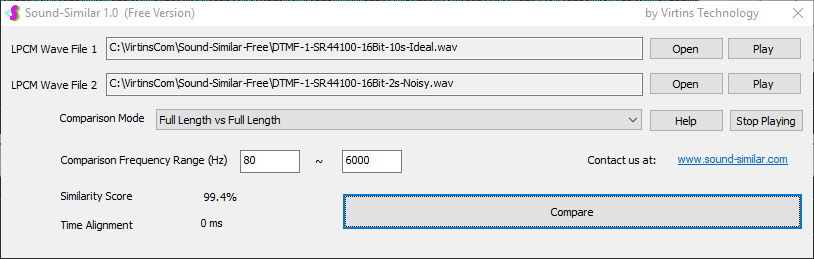 (5) Electrical Substation Sound Recognition (NEGATIVE): Substation-60Hz-High-Votage-Transformer-Sound-SR44100-16Bit-2s.wav vs Substation-60Hz-Partial-Discharge-Sound1-SR44100-16Bit-2s.wav The former is a 2-second sound from a high voltage transformer while the latter is a 2-second sound emitted by a partial discharge event in a substation. The former is quite stationary but the latter is not quite so. The measured similarity score is 0.6%. In other words, the partial discharge sound can be differentiated from the hum. It should be noted that the lower limit of the comparison frequency range was set to 30Hz to take into account the 50Hz or 60Hz hum in comparison. 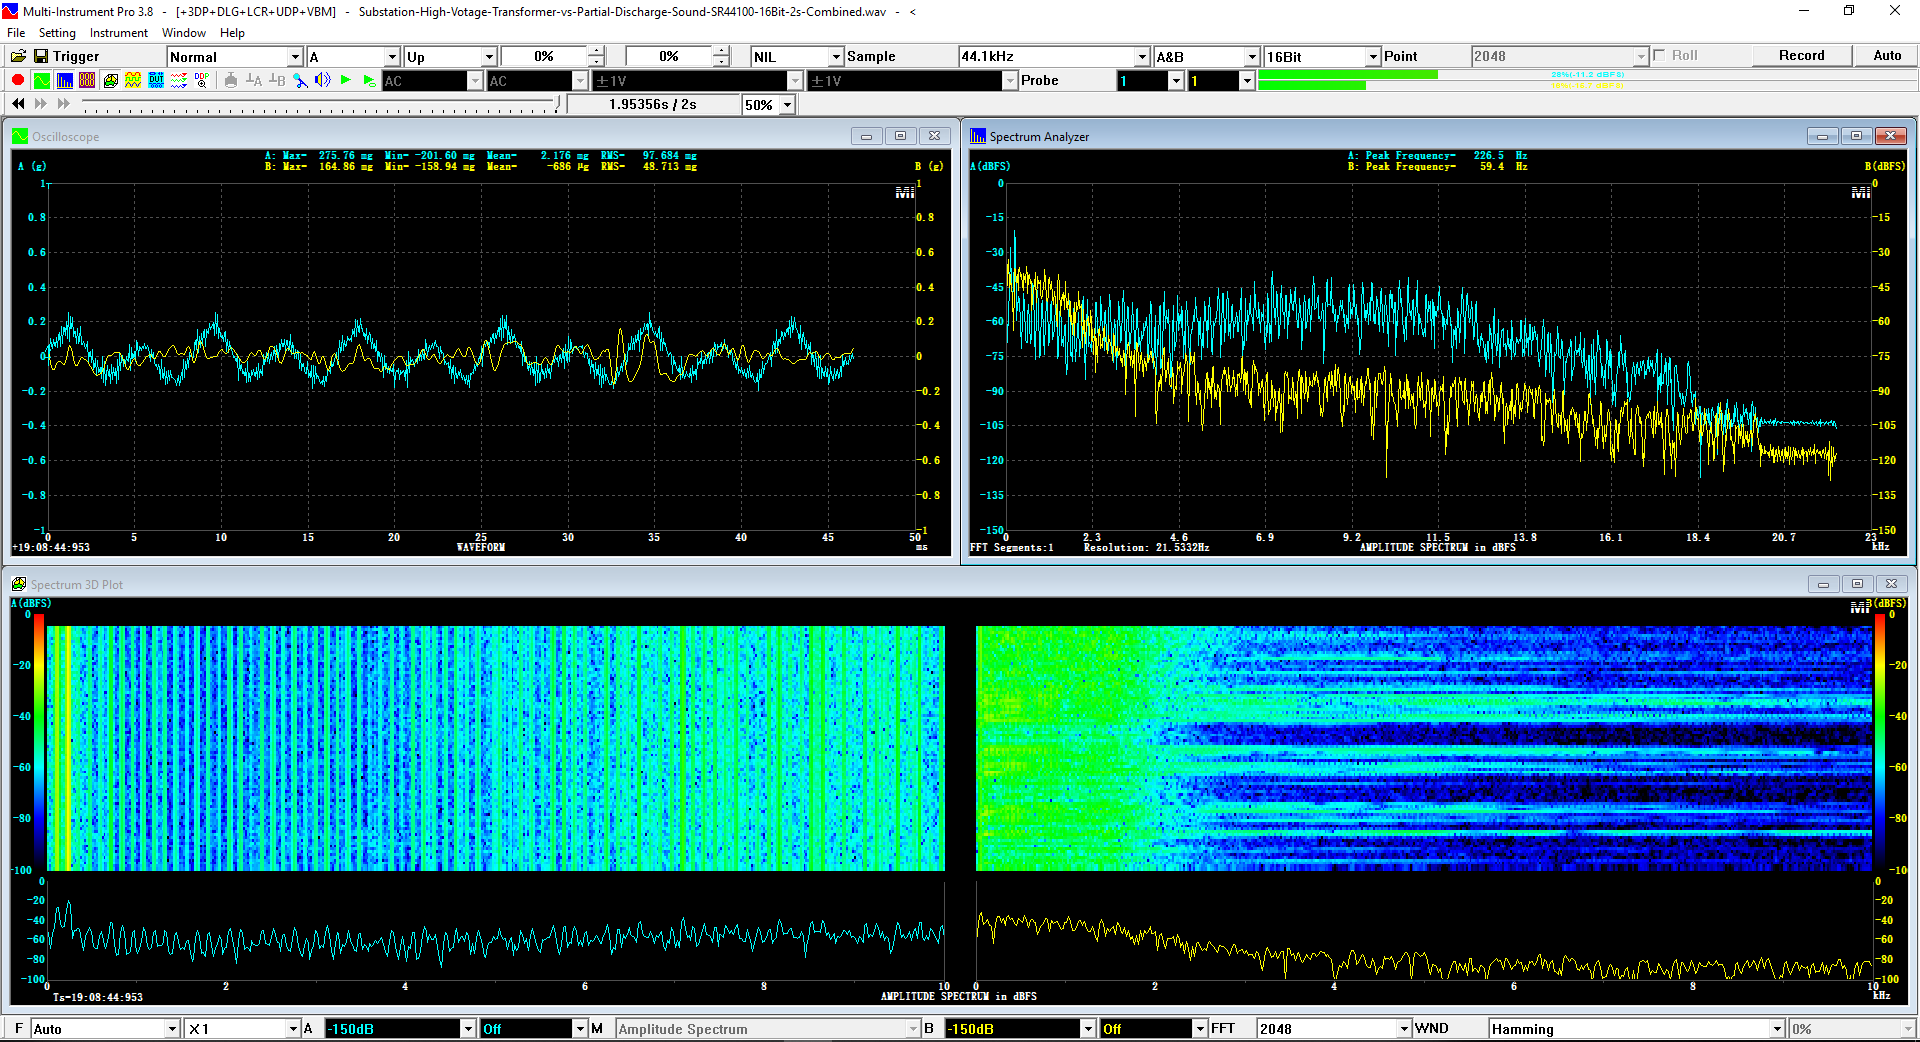 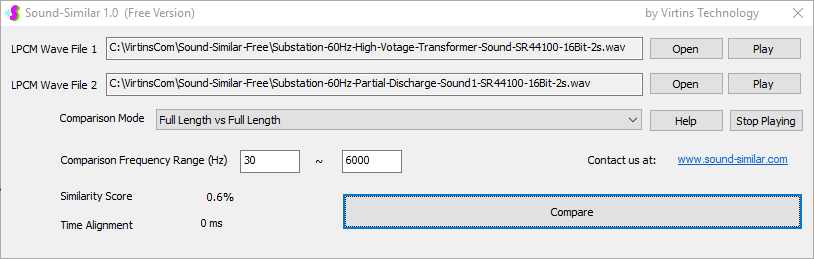 (6) Electrical Substation Sound Recognition (POSITIVE): Substation-60Hz-Partial-Discharge-Sound1-SR44100-16Bit-2s.wav vs Substation-60Hz-Partial-Discharge-Sound2-SR44100-16Bit-2s.wav Both are 2-second partial discharge sounds in a substation. The measured similarity score is 84.5%. In other words, the two sounds can be classified under the same tag. It should be noted that the lower limit of the comparison frequency range was set to 30Hz to take into account the 50Hz or 60Hz hum in comparison. 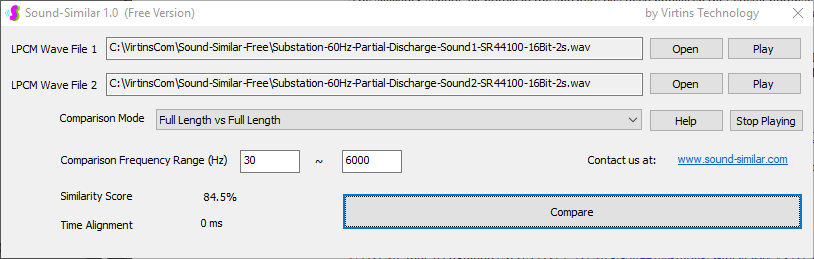 2. Non-Stationary Sound Comparison Examples: (1) Music recognition 1 (POSITIVE): Piano-1-1-SR44100-16Bit-10s.wav vs Piano-1-2-SR44100-16Bit-10s.wav Both were recorded from the same music clip but with different speaker and microphone pairs and different background noises and echoes. The measured similarity score is 90.9%. 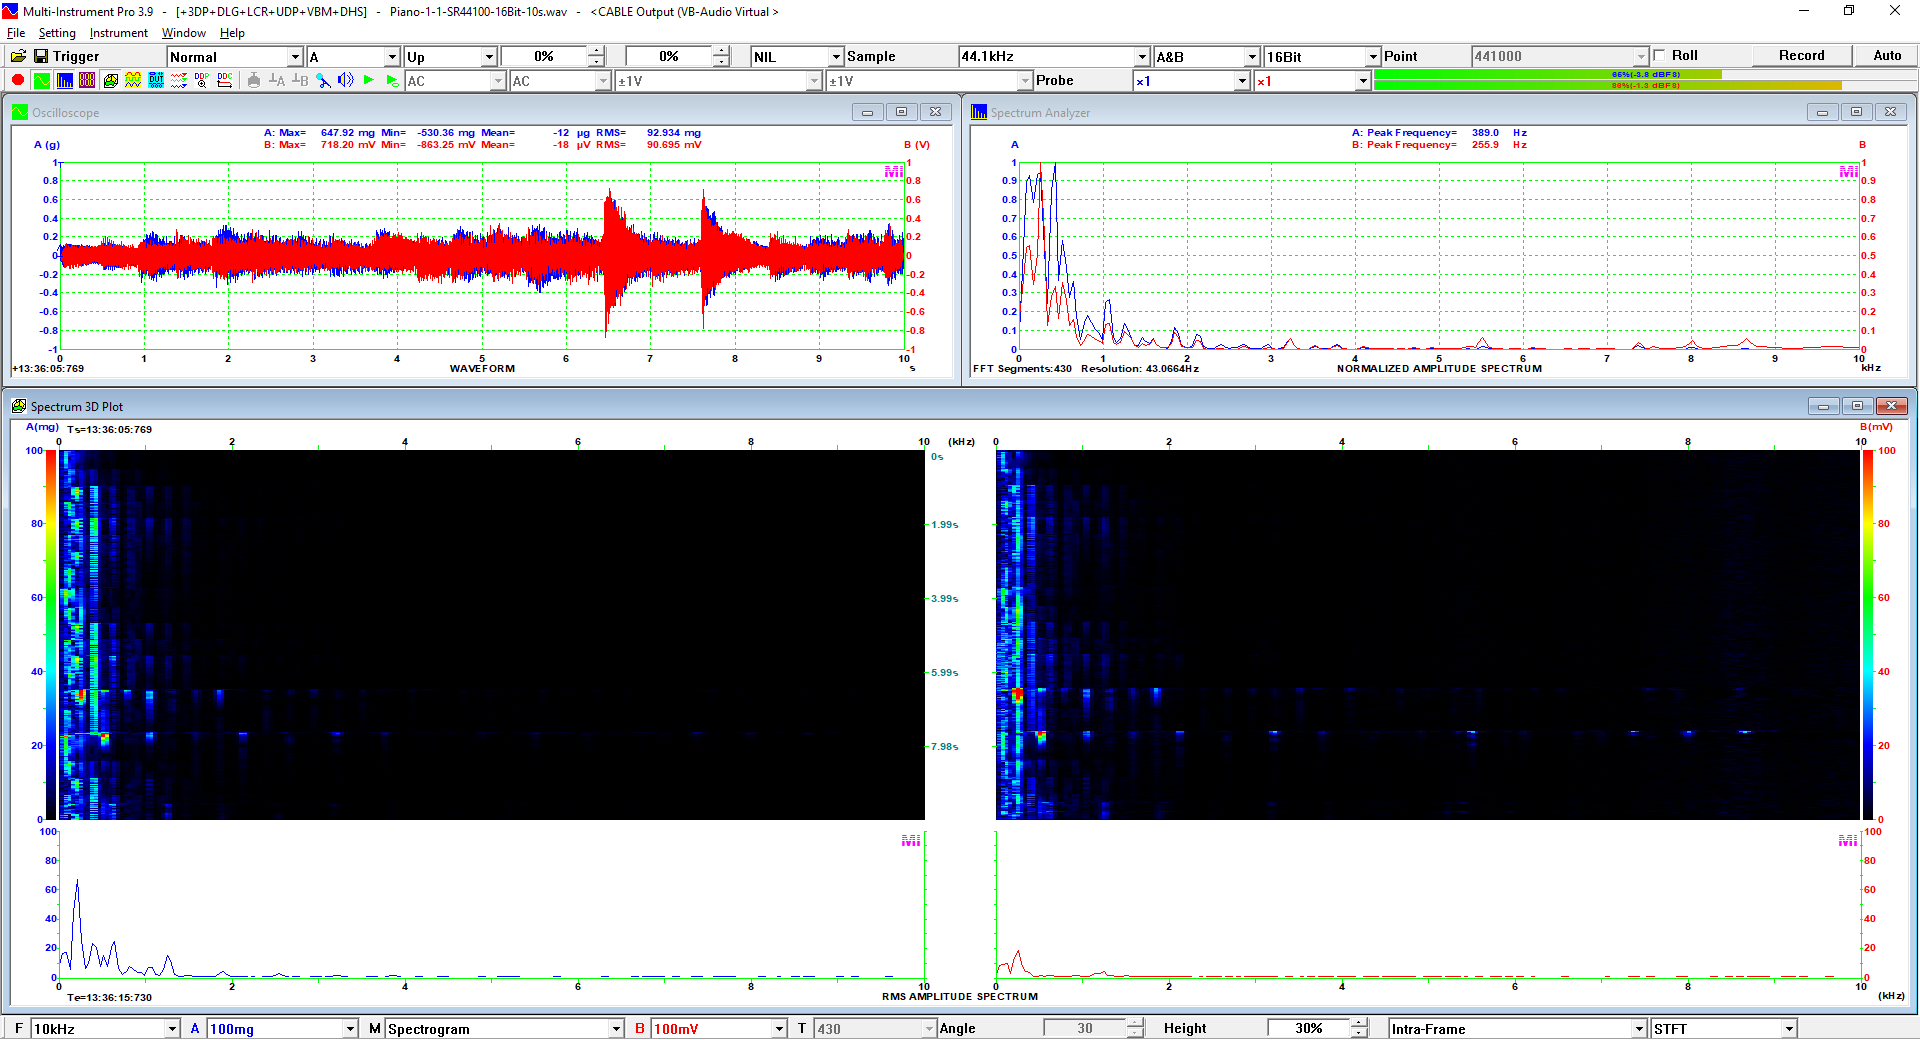  (2) Music recognition 2 (POSITIVE): Piano-2-1-SR44100-16Bit-10s.wav vs Piano-2-2-SR44100-16Bit-10s.wav Both were recorded from the same music clip but with different speaker and microphone pairs and different background noises and echoes. The measured similarity score is 91.5%.  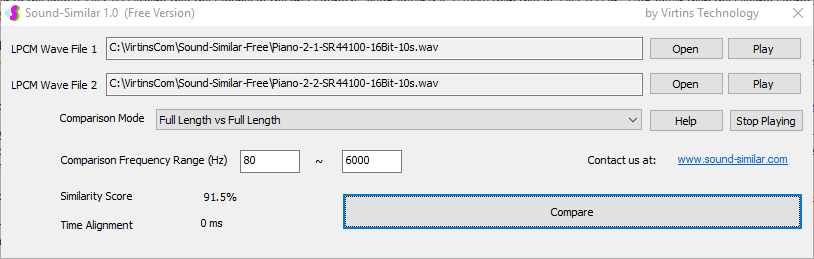 (3) Music recognition (NEGATIVE): Cross-check the wav files in the above 2(1) and 2(2) i) Piano-1-1-SR44100-16Bit-10s.wav vs Piano-2-1-SR44100-16Bit-10s.wav: similarity score 0.5%   ii) Piano-1-1-SR44100-16Bit-10s.wav vs Piano-2-2-SR44100-16Bit-10s.wav: similarity score 0.5% 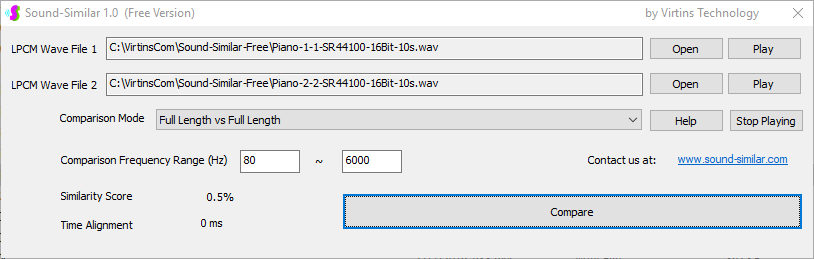 iii) Piano-1-2-SR44100-16Bit-10s.wav vs Piano-2-1-SR44100-16Bit-10s.wav: similarity score 0.6%  iv) Piano-1-2-SR44100-16Bit-10s.wav vs Piano-2-2-SR44100-16Bit-10s.wav: similarity score 0.5%  (4) Song recognition 1 (POSITIVE): Song-1-1-SR44100-16Bit-10s.wav vs Song-1-2-SR44100-16Bit-10s.wav Both were recorded from the same song clip but with different speaker and microphone pairs and different background noises and echoes. The measured similarity score is 71.9%.   (5) Song recognition 2 (POSITIVE): Song-2-1-SR44100-16Bit-10s.wav vs Song-2-2-SR44100-16Bit-10s.wav Both were recorded from the same song clip but with different speaker and microphone pairs and different background noises and echoes. The measured similarity score is 83.5%.  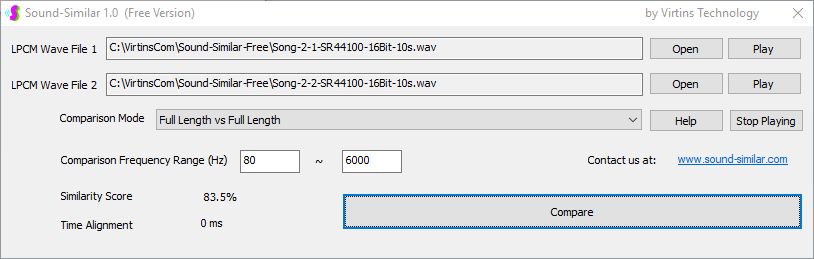 (6) Song recognition (NEGATIVE): Cross-check the wav files in the above 2(4) and 2(5) i) Song-1-1-SR44100-16Bit-10s.wav vs Song-2-1-SR44100-16Bit-10s.wav: similarity score 0.3%   ii) Song-1-1-SR44100-16Bit-10s.wav vs Song-2-2-SR44100-16Bit-10s.wav: similarity score 0.2%  iii) Song-1-2-SR44100-16Bit-10s.wav vs Song-2-1-SR44100-16Bit-10s.wav: similarity score 0.2%  iv) Song-1-2-SR44100-16Bit-10s.wav vs Song-2-2-SR44100-16Bit-10s.wav: similarity score 0.3%  (7) Speech recognition 1 (POSITIVE): Speech-1-1-SR44100-16Bit-2s.wav vs Speech-1-2-SR44100-16Bit-2s.wav Both were recorded from the same speech clip ("Because these two really sounds similar!") but with different speaker and microphone pairs and different background noise levels and echoes. The measured similarity score is 80.5%.   (8) Speech recognition 2 (Similar): Speech-1-1-SR44100-16Bit-2s.wav vs Speech-1-3-SR44100-16Bit-2s.wav The former is a speech clip "Because these two really sound similar!" while the latter is a speech clip "Because these two really sound different!". That is, only the last words are different. The measured similarity score is 60.5%.  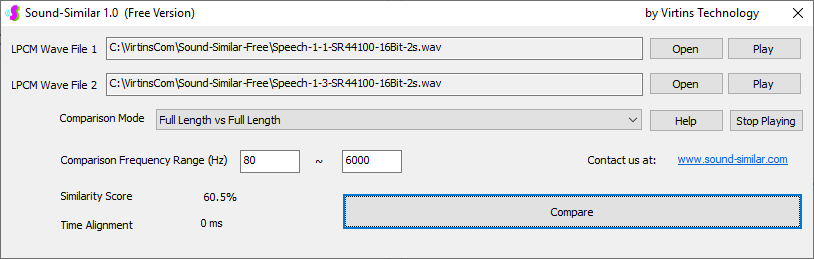 (9) Speech recognition 3 (Similar): Speech-1-1-SR44100-16Bit-2s.wav vs Speech-1-4-SR44100-16Bit-2s.wav The former was a speech clip "Because these two really sound similar!" while the latter was a speech clip "Because these two sound really similar!". That is, only the positions of two words are swapped, which is in a way equivalent to a two-word difference. The measured similarity score is 9.7%.  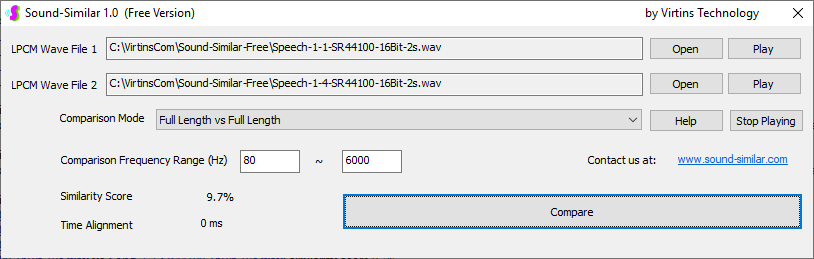 (10) Speech recognition 4 (Similar): Speech-1-1-SR44100-16Bit-2s.wav vs Speech-1-5-SR44100-16Bit-2s.wav The former was a speech clip "Because these two really sound similar!" while the latter was a speech clip "Because these two sound similar really!". That is, only the positions of three words are changed, which is in a way equivalent to a three-word difference. The measured similarity score is 1.4%.  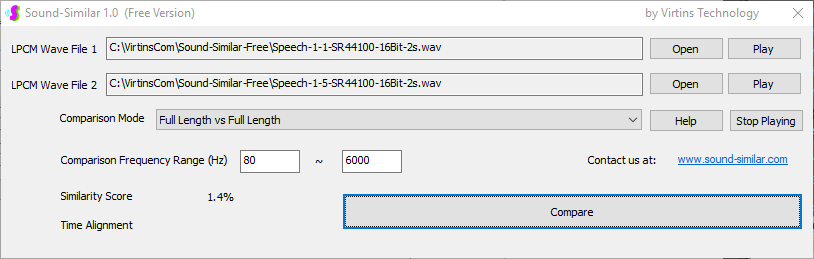 (11) Searching the shorter WAV File in the longer one: Song-3-2-SR44100-16Bit-1s.wav in Song-3-1-SR44100-16Bit-20s.wav The two files were recorded with different speaker and microphone pair and different background noises and echoes. The former contains a 1-second excerpt of a song while the latter contains a 20-second excerpt of the same song. The comparison mode is set to "Full Length of the Shorter vs Partial Length of the Longer". The result shows that the sound from 14.477 s to 15.477 s in the second file is similar to the entire sound in the first file with a similarity score of 55.2%.  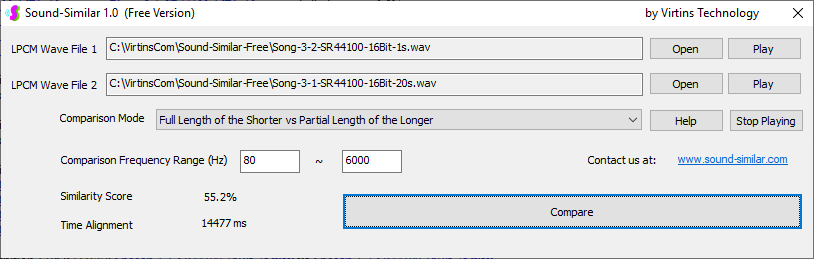 |
| Home | Products | Downloads | Order | Support | Applications | Forum | Testimonials | Company | Contact Us |
|